Regression 6. Finding Unknown Parameters with OLS - Solved Manual Example
You can learn how to perform linear regression by watching my YouTube video.
Numeric Example
A hypothetical dataset about how online gaming habits affects marks involving children in the age group of 10-15 is tabulated. The first feature is the number of hours in a day spent in gaming. The second feature gives the average marks of the students who spend so many hours in gaming.

Problem Statement
Find the regression coefficients m and c in the linear regression model using Least Squares Approach:
y = c+ m*x
Step 1:
We need to check if there is linearity between the dependent and independent variables by plotting the scatter plot.
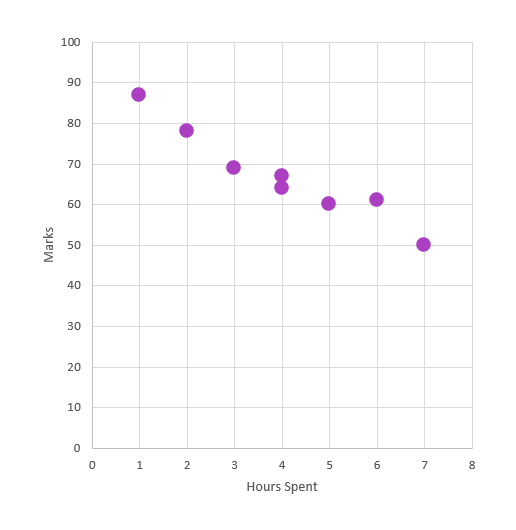
We see that there is a linear relationship between the data and so we can apply linear regression.
From the blog on OLS, we know to calculate c and m as :

This can be easily calculated by hand with a table as follows:

So, the regression equation representing the relationship between 'Hours Spent' and 'Marks (%)' is:
This means, for each additional hour spent, the marks decrease by 5.5%, starting from 89% for zero hours spent.
Predicting for unseen data
Assume we need to find the marks a student who spends 1.5 hours will get. Plugging in the regression line we get,
Marks = 89 - 5.5*1.5
= 80.75
This helps us predict unseen data with the line of best fit.
Github Link for Code:
Comments
Post a Comment